Can A Curve Be Flat? Developments In India’s Yield Curve
A quote in a Financial Times article read, “Investors do not have a crystal ball, but the yield curve is the next best thing”.
The yield curve refers to the graphical representation of the interest rates on Government Bonds with different maturity periods. It shows the relationship between the maturity periods of the bonds (short-term to long-term) with the corresponding interest rates. It is a significant indicator in the world of finance and provides key insights into interest rates and market expectations. It plays a significant role in shaping investment decisions, monetary policy, and economic forecasting. This article aims to throw light on the concept of the yield curve, types of yield curves, factors influencing the yield curve, and current trends in the Indian market.
Definition And Construction
The yield curve is plotted with interest rates (yields) on the y-axis and the maturity period on the x-axis. The yield curve shows the interest rates that investors in bonds demand to invest over various periods - for one month, 5 years, 10 years, or even 40 years. The yield curve is usually upward-sloping, whereby a higher fixed rate of return is earned from investing money for longer periods.
Yield Curve Shapes And Interpretation
In an economic expansion phase, the slope of the yield curve is generally upwards signifying long-dated bonds have higher yields compared to short-term bonds. This shape of the yield curve is considered normal and reflects the expectation of higher inflation and economic growth over time. However, the slope of the yield curve can change depending on market conditions and expectations.
Types Of Yield Curves

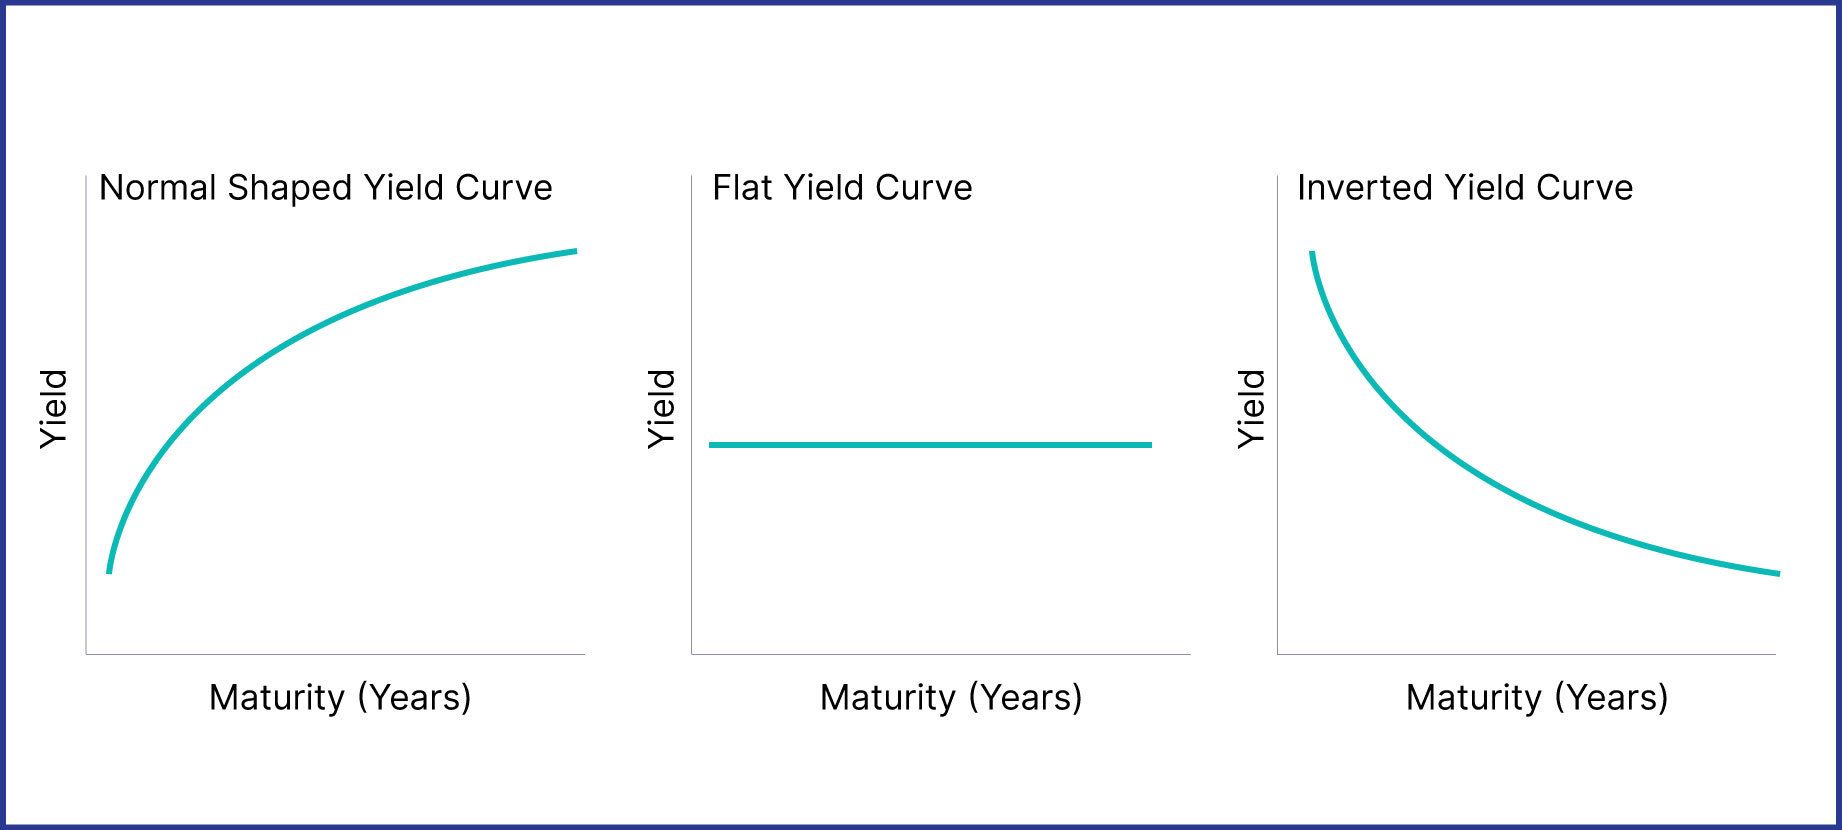
Normal Yield Curve: The upward-sloping yield curve indicates higher yields for longer-term bonds and is considered normal. This shape indicates that yields on longer-term bonds will continue to rise in response to periods of economic expansion.
An example of this curve includes a 1-year bond that offers a yield of 6.80%, a 5-year bond that offers a yield of 7.00%, a 10-year bond that offers a yield of 7.05%, and a 30-year bond that offers a yield of 7.35%.
Flat Yield Curve: A flat yield curve occurs when anticipated interest rates are steady, or short-term volatility outweighs long-term volatility. It is at a period where yields are almost equal across all maturities. It signifies that the difference between yields on short-term and long-term bonds minimises, in effect giving no incentives for investors to invest for the long term. It indicates the uncertainty of future economic conditions and can precede periods of economic slowdowns.
In such a market, many investors will flock towards short-term bonds (6-24 months) over long-term bonds (48+ months). Over the last year, we have seen this reflect in investor preference for investment tenure on Grip Invest, with the majority of investors preferring short-tenure investments.

Inverted Yield Curve: An inverted yield curve occurs when short-term rates are more than long-term rates. This curve slopes downwards and has historically been associated with economic recessions. It implies that the market is expecting future interest rate cuts and economic weakness. In the period of recessions, investors tend to purchase longer-dated bonds in pursuit of safe investments leading to the increase in prices of longer-dated bonds which in turn lower their yields.
Examples of an Inverted Yield Curve Plot points on the curve may include a 1-year bond that offers a yield of 7.20%, a 5-year bond that offers a yield of 7.00%, a 10-year bond that offers a yield of 6.80%, a 30-year bond that offers a yield of 6.5%.
Factors Influencing The Yield Curve
- Monetary Policy: Reserve Bank of India (RBI) conducts monetary policy operations to manage short-term interest rates and liquidity in the banking system. These operations include open market operations (buying and selling Government Securities), Repo Rate adjustments (the rate at which RBI lends to banks), and reserve requirements (CRR and SLR). The RBI's actions and policies impact the yield curve by influencing short-term interest rates.
- Economic Growth Prospects: The shape of the yield curve is dependent on the anticipation of economic growth. Stronger growth prospects result in higher long-term yields. Contrarily, weaker growth expectations will flatten or invert the curve.
- Inflation Expectations: Inflation is one of the significant drivers of long-term interest rates. Expectations of higher inflation lead to steep yield curves as investors demand higher yields to compensate for the diminishing purchasing power of their future cash flows.
- Global Factors: Global interest rate trends, capital flows, and geo-political events can impact the yield curve. Changes in global interest rates can influence demand for Indian bonds by Foreign Investors which in turn affects the yields.
Current Trends In The Indian Bond Market
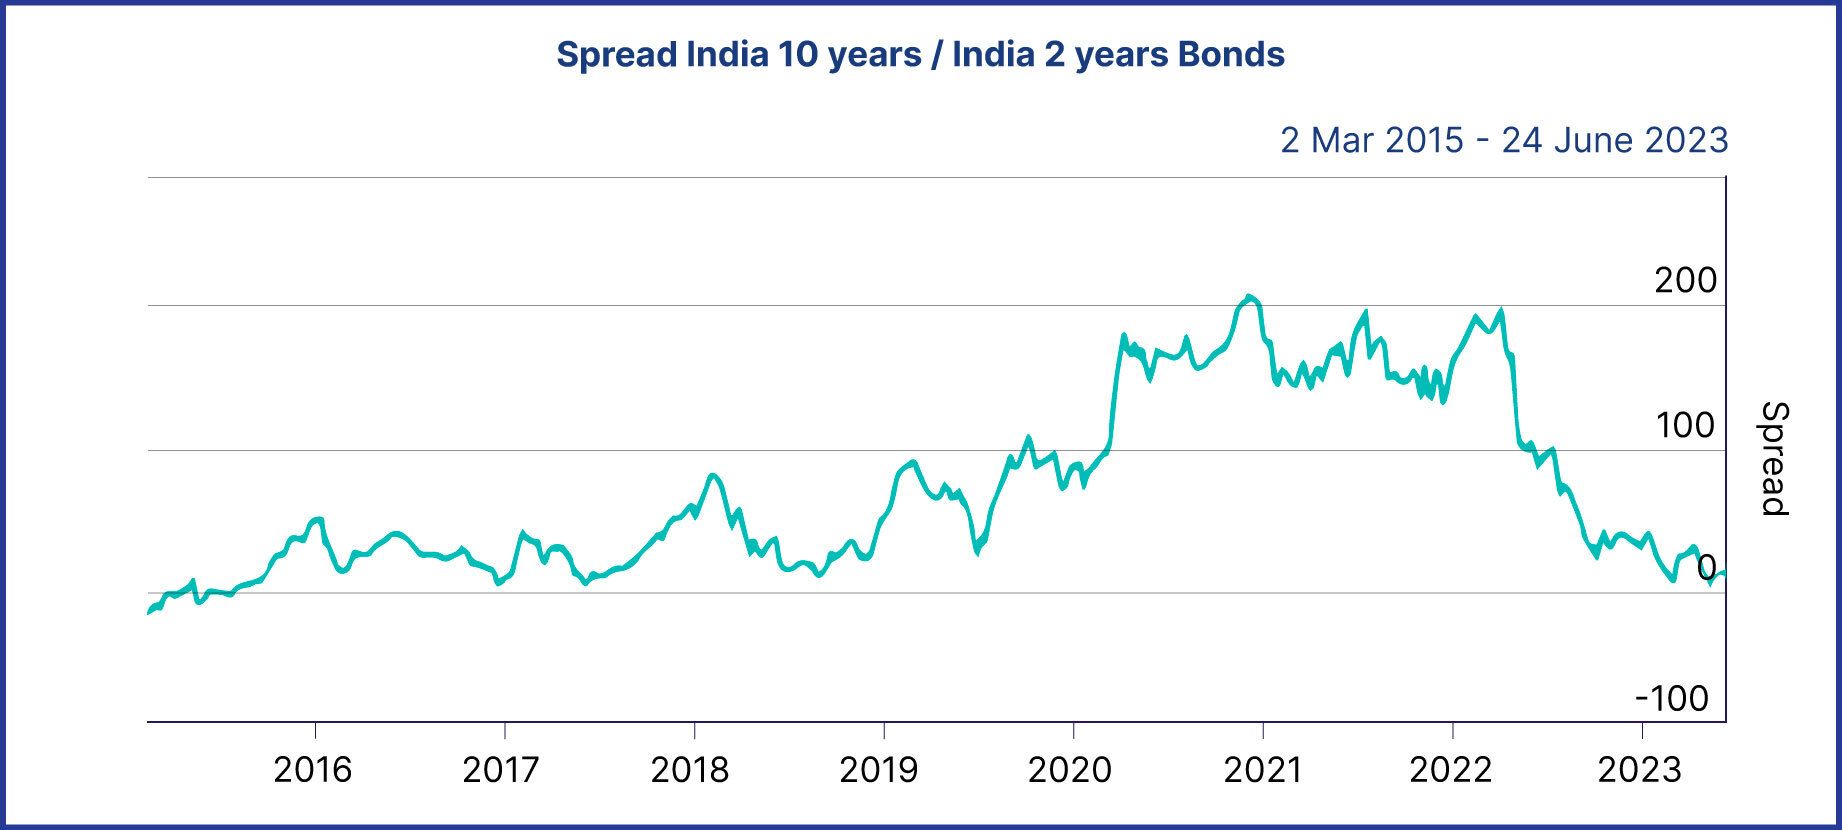
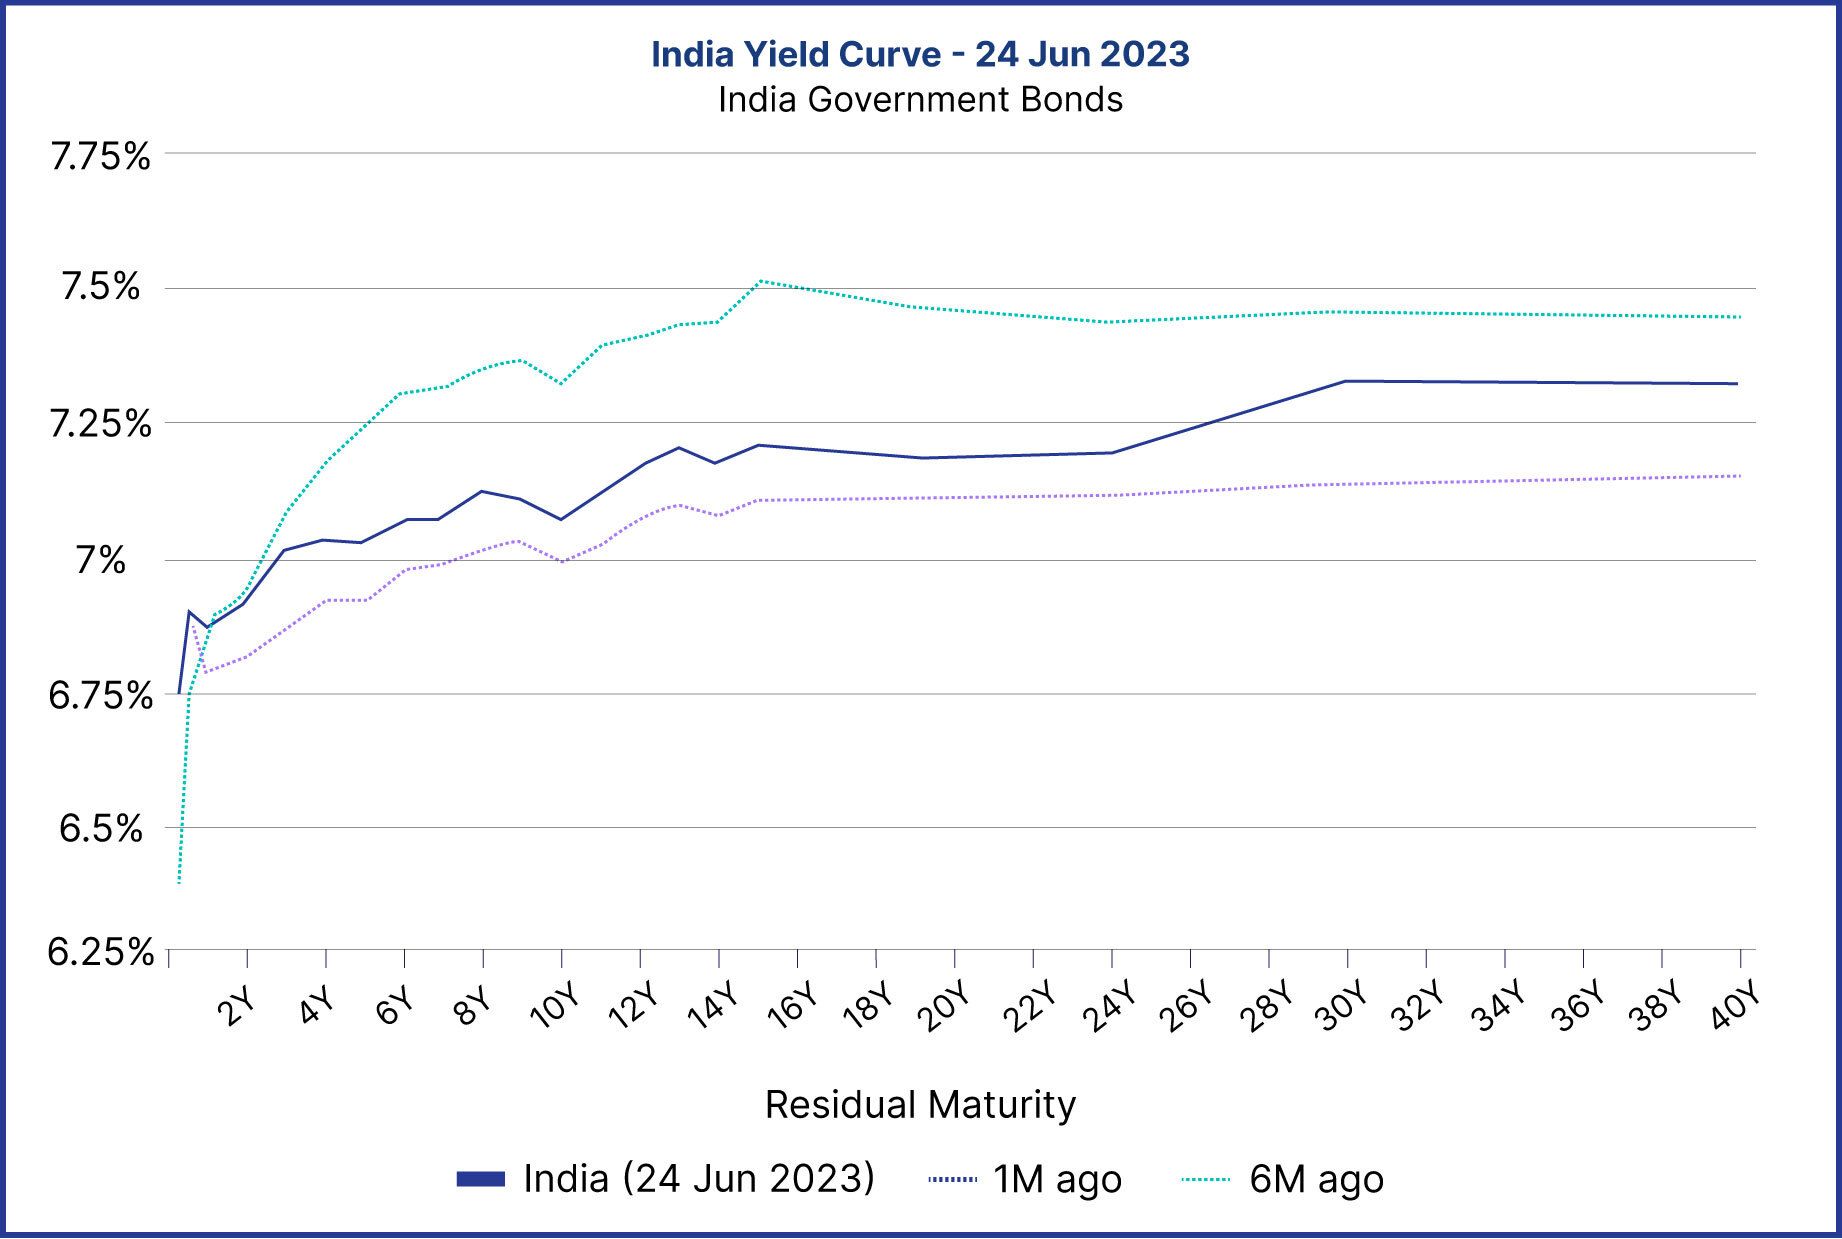
Almost exactly a year ago, the yield curve started flattening i.e. the annual rate of return expected for a 10-year investment and a 2-year investment started becoming similar. Today India’s yield curve for government bonds is almost completely flat.

As the chart depicts, between 2016-2022, investors expected to receive a higher annual return (as much as 200 bps higher in 2022) from a 10-year investment vs. a 2-year investment in government bonds.
However, as of today, that difference is just 15 bps. As the yield curve below shows, even the difference in annual return expected from a 40-year investment vs. a 2-year investment is just 40 bps.

The yield curve is a vital tool for understanding interest rates, market expectations, and economic conditions. It reflects a complex interplay of factors such as monetary policy, inflation expectations, economic growth prospects, and global influences. By monitoring and interpreting the yield curve, investors, borrowers, policymakers, and analysts can gain valuable insights for making informed decisions in the Indian financial landscape.
For example, an inverted yield curve (where short-term rates are higher than long-term rates) has been historically associated with economic slowdowns or recessions. However, the shape and interpretation of the yield curve should be analyzed in the context of specific market conditions and economic indicators.
Keeping in mind the current shape of the yield curve we at Grip are adding more short-tenure investment options as we believe it will help our users take advantage of the current interest rate cycle.
As inflation continues to reduce, encouraging the RBI to reduce interest rates, the yield curve should return to its original upward-sloping shape. We will accordingly shift the mix of investment options to be more long-term for the benefit of our users.
Want to stay at the top of your finances? Don’t forget to sign up!
Join the community of 2.5 lakh + investors and learn more about Grip, the latest financial knick-knacks and shenanigans that take place in the world of investing.
Happy Investing!
Disclaimer: This communication does not constitute advice relating to investing or otherwise dealing in securities and is not an offer or solicitation for the purchase or sale of any securities. Grip Invest Technologies Private Limited ("Grip", formerly known as Grip Invest Advisors Private Limited) is not registered with SEBI in any capacity and does not advise, encourage, or discourage its users to invest or not invest in any securities. Grip is solely an execution-only platform and does not guarantee or assure any return on investments made by you in any opportunities sourced by Grip and accepts no liability for consequences of any actions taken based on the information provided. Your investment is solely based on your judgement. Investments in debt securities are subject to risks. Read all the offer-related documents carefully.


